


Loading game details
MTL AT OTT
Tue, Sep 30, 2025
 MTL
 OTT
Habs Hockey
MTLOTTOpen Game HubClose Game Hub
2026–27 regular season · as of Nov 17, 2026 · 12-5-4 · 28 PTS
HABS PULSE
The Canadiens. At a glance.
Through Nov 16, 2026
The Shift
Less offence.
2–2–1 · last five games
5/10 points banked
Player Watch
Last 5 appearances
Game Watch
Can the power play break through?
MTL @ NYR · Nov 16, 2026
MTL 1 – 3 NYR · FINAL
MTL power play: 0/4THE WEEK AHEAD
Nov 16–Nov 22, 2026
MTL @ NJD
2026-11-18
NJD · 2 extra days off before this game.
Scheduled workload · includes this game
Travel & schedule context
Travel adds straight-line distances between scheduled regular-season arenas within this week; it excludes the trip into the first game and the return home. Difficulty is a site estimate using current-season opponent points percentage, away games, Montreal back-to-backs and that travel. Each opponent needs five games. It is not the team’s reported itinerary.
The line connects scheduled arena cities. Dotted legs have passed their destination’s scheduled game time. The plane marks today’s game in your local timezone, not a live flight. Unknown or neutral venues have no assumed city or progress.
Rest counts full NHL calendar days off before the game. Four-night workload includes the selected game and the previous three dates. Upcoming games are scheduled context, not games already played.
Habs Daily Pulse
Through
One insight. Player form. Matchup context.
Refresh delayed. Keeping the last verified analysis.
Lead insight
Scoring at 2.40 goals per game
Montreal scored 12 goals in its last five completed games, versus 21 in the five before (4.20 per game).
Previous window:
Player Pulse
Last 5 appearancesCooling offNick Suzuki2 PTS-73% vs baseline

Points per appearance fell from 1.50 across 10 earlier appearances to 0.40 in the latest five.
| Measure | Last 5 | Earlier 10 |
|---|---|---|
| Goals | 2 | 6 |
| Assists | 0 | 9 |
| Points | 2 | 15 |
| Shots | 8 | 30 |
| Points / appearance | 0.40 | 1.50 |
| Shots / appearance | 1.60 | 3.00 |
| Points / 60 min | 1.23 | 4.17 |
| Shots / 60 min | 4.90 | 8.33 |
Recent:
Baseline:
Played in the latest completed game. The next lineup is not confirmed by these statistics.
Breakout watchAlexandre Texier13 SHOTS+89% vs baseline

Shots per appearance rose from 1.38 to 2.60, while points per appearance were 0.00 versus a 0.31 baseline. A watchlist signal, not a promise of a goal.
| Measure | Last 5 | Earlier 16 |
|---|---|---|
| Goals | 0 | 2 |
| Assists | 0 | 3 |
| Points | 0 | 5 |
| Shots | 13 | 22 |
| Points / appearance | 0.00 | 0.31 |
| Shots / appearance | 2.60 | 1.38 |
| Points / 60 min | 0.00 | 1.42 |
| Shots / 60 min | 10.49 | 6.24 |
Recent:
Baseline:
Played in the latest completed game. The next lineup is not confirmed by these statistics.
Next matchup
Game HubPulse covers the current or upcoming matchup; Game Hub is showing another game.
MTL @ NJD ·
- NJD has taken 8 of 10 points in its last 5 games (4–1–0).
- Montreal has 1 full rest day; its opponent has 3.
What to watch
- Last 5: MTL PP 1/14 (7.1%) vs NJD PK 6/10 (60.0%).
- Watch Montreal’s 2.40-goals/game attack against NJD’s 2.80 allowed (last 5).
- Watch Montreal’s defensive test: NJD scores 4.60 goals per game; Montreal allows 2.60 over the last five.
Full Pulse analysis & sourcesLast game outcomes available
Pregame record & last game
Upcoming game: MTL · NJD ·
Pregame watchlist saved: .
- Nick SuzukiTracking 1+ point
- Alexandre TexierTracking 3+ shots
Last completed game: MTL · NYR ·
Outcomes from the confirmed final box score.
- Kirby Dach0 G · 0 A · 0 shots
- Juraj Slafkovský0 G · 0 A · 3 shots
- Lane Hutson0 G · 1 A · 1 shots
The numbers behind Pulse
2026–27 · Regular season
Streaks use the full verified sequence of completed games in the stated season and competition. The last-ten record is a separate window. Player signals compare five actual appearances with at least ten earlier appearances in the same season and competition. Missing data stays unavailable; shootout deciding goals are excluded from goal rates.
Pulse follows the current daily matchup. Selecting an archived game in the Game Hub does not rewrite this analysis.
- NHL source (external site)
- NHL source (external site)
- NHL source (external site)
- NHL source (external site)
- NHL source (external site)
- NHL source (external site)
- NHL source (external site)
- NHL source (external site)
- NHL source (external site)
- NHL source (external site)
Sources checked: .
Public data access does not resolve provider licensing or reuse rights.
Habs at a Glance
Nov 16–Nov 22, 2026
 @ NYR
 @ NJD
 @ CAR
Travel & Difficulty
Travel adds straight-line distances between scheduled regular-season arenas within this week; it excludes the trip into the first game and the return home. Difficulty is a site estimate using current-season opponent points percentage, away games, Montreal back-to-backs and that travel. Each opponent needs five games. It is not the team’s reported itinerary.
12-5-4 · 28 PTS
Montreal currently holds an Atlantic playoff place.
Home & Away
2026–27 · Regular Season| Home | Statistic | Away |
|---|---|---|
| 5–3–3 | Record | 7–2–1 |
| 11 | Games Played | 10 |
| 59.1% | Points % | 75.0% |
| 2.91 | Goals / Game | 3.50 |
| 3.64 | Against / Game | 2.40 |
| 53.1% | 5v5 Shot Share | 47.0% |
| 53.2% | 5v5 Unblocked | 50.6% |
5v5 coverage · Home 11/11 · Away 10/10 games
| Home | Statistic | Away |
|---|---|---|
| 15.8% | Power Play % | 7.7% |
| 6 / 38 | PP Goals / Chances | 2 / 26 |
| 73.9% | Penalty Kill % | 85.3% |
| 34 / 46 | Kills / Chances | 29 / 34 |
| 12 | PP Goals Against | 5 |
Detail coverage · Home 11/11 · Away 10/10 games
| Home | Statistic | Away |
|---|---|---|
| 0.879 | Save % | 0.917 |
| 3.22 | Goals Against Avg. | 2.43 |
| 26.7 | Shots Faced / 60 | 29.2 |
| 262 / 298 | Saves / Shots | 264 / 288 |
| 1 | Team Shutouts | 1 |
Detail coverage · Home 11/11 · Away 10/10 games
Completed games · NHL home/away designation
Stats Key
Record: wins–losses–overtime losses. PP and PK are weighted by opportunities. 5v5 shot share counts shots on goal; unblocked share adds missed shots and excludes blocks. Both exclude empty nets. These measure shot volume, not shot quality or expected goals.
Save % uses total saves divided by shots faced. GAA is goals allowed per 60 minutes of goalie ice time, including overtime. Empty-net and shootout goals are excluded from goalie stats; shootout deciders are also excluded from goals-per-game rates. Team shutouts include shared shutouts. A dash means no opportunities or incomplete data; coverage shows how many games have the required detail.
Recent Moves
All Moves →More recent moves
Canadiens announcements · Checked Nov 17, 3:00 PM ET
Recent Moves
All Moves →Autres mouvements récents
Canadiens announcements · Checked Nov 17, 3:00 PM ET
Habs Journal
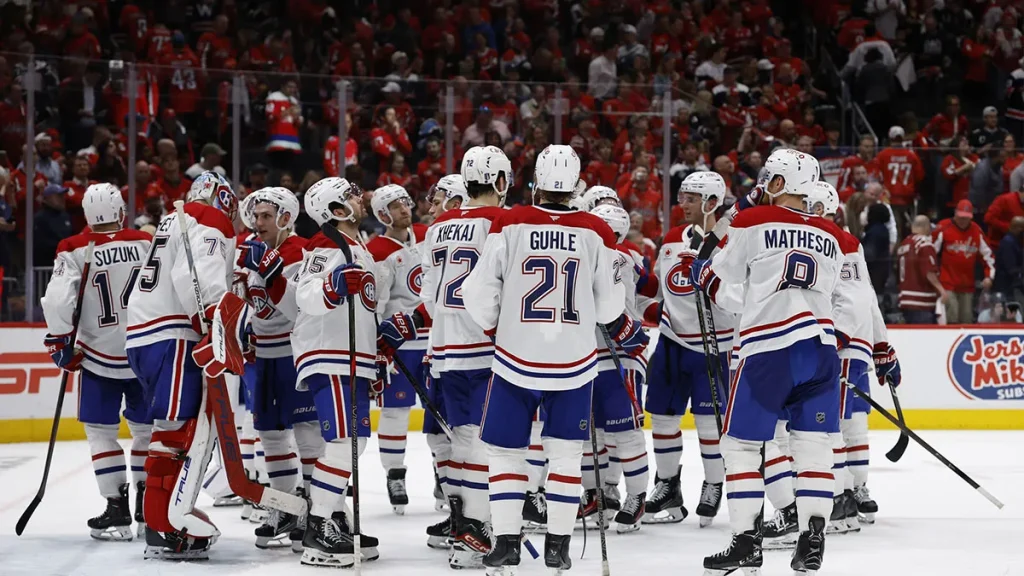
New Season, Same Mindset
With new faces, bold trades, and expectations rising, the Montreal Canadiens enter the 2025-26 season ready to prove that last year's success was no…